Code
library(BIGL)
library(knitr)
library(rgl)
library(ggplot2)
library(broom)
library(kableExtra)
set.seed(12345)
cutoff <- 0.95
caz_gent_kpcb <- read.csv("~/Desktop/ACUTEWEBSITE/datasets_combo/caz_gent_kpcb.csv")
## Fitting marginal models, maximal fixed at 24 hours, minimal at 9.5 hours
marginalFit <- fitMarginals(caz_gent_kpcb, method = "optim",
                            fixed = c("m1" = 24, "m2" = 24, "b" = 9.5),
                            names = c("CTZ/AVI", "GENT"))
summary(marginalFit)
Formula: effect ~ fn(h1, h2, b = 19/2, m1 = 24, m2 = 24, e1, e2, d1, d2)
Transformations: No
CTZ/AVI GENT
Slope 9.271 13.756
Maximal response 24.000 24.000
log10(EC50) 1.930 1.327
Common baseline at: 9.5Code
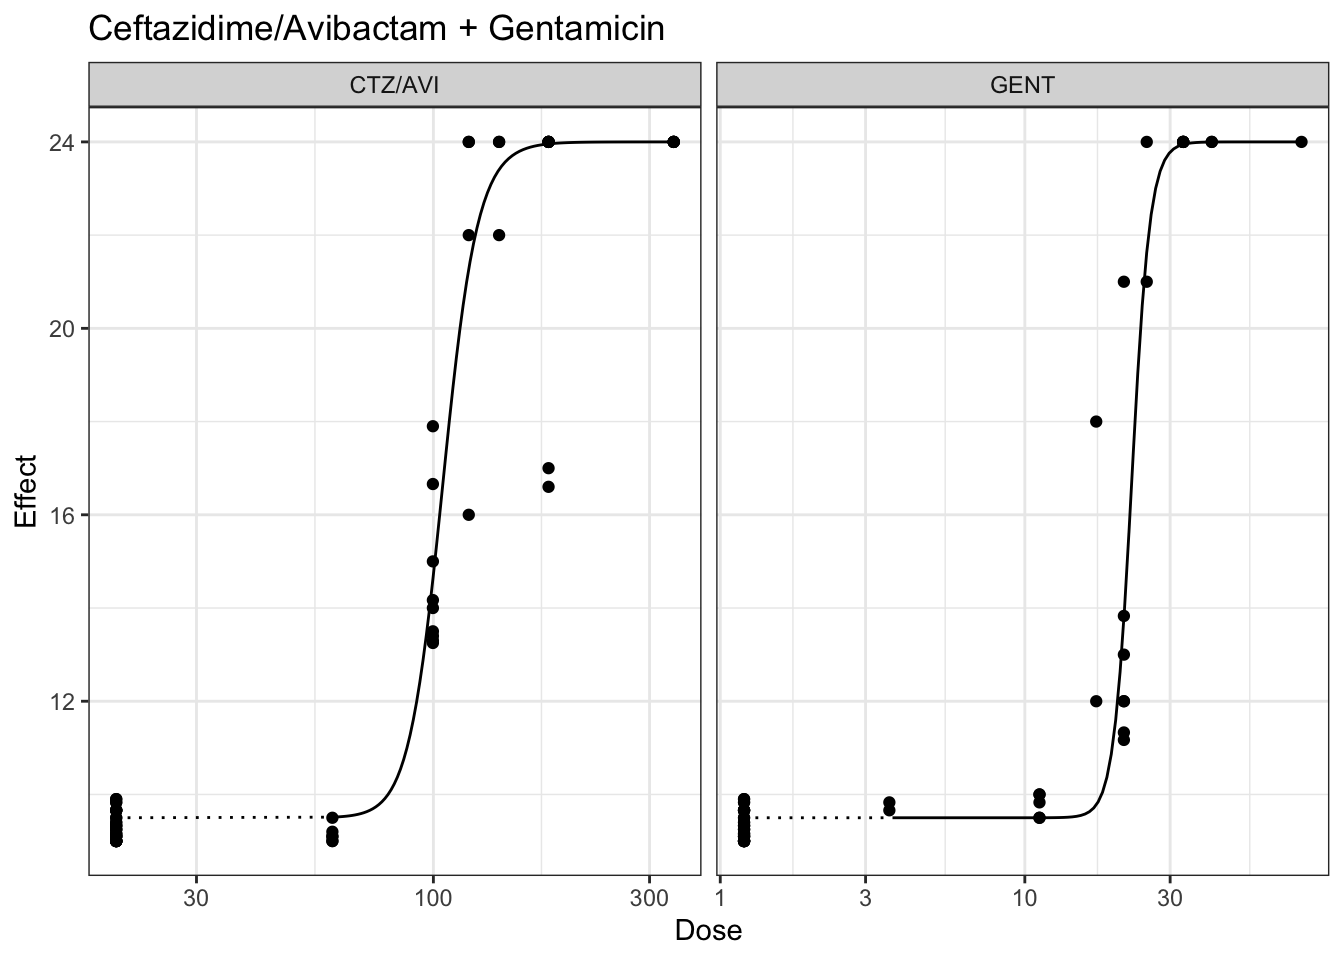
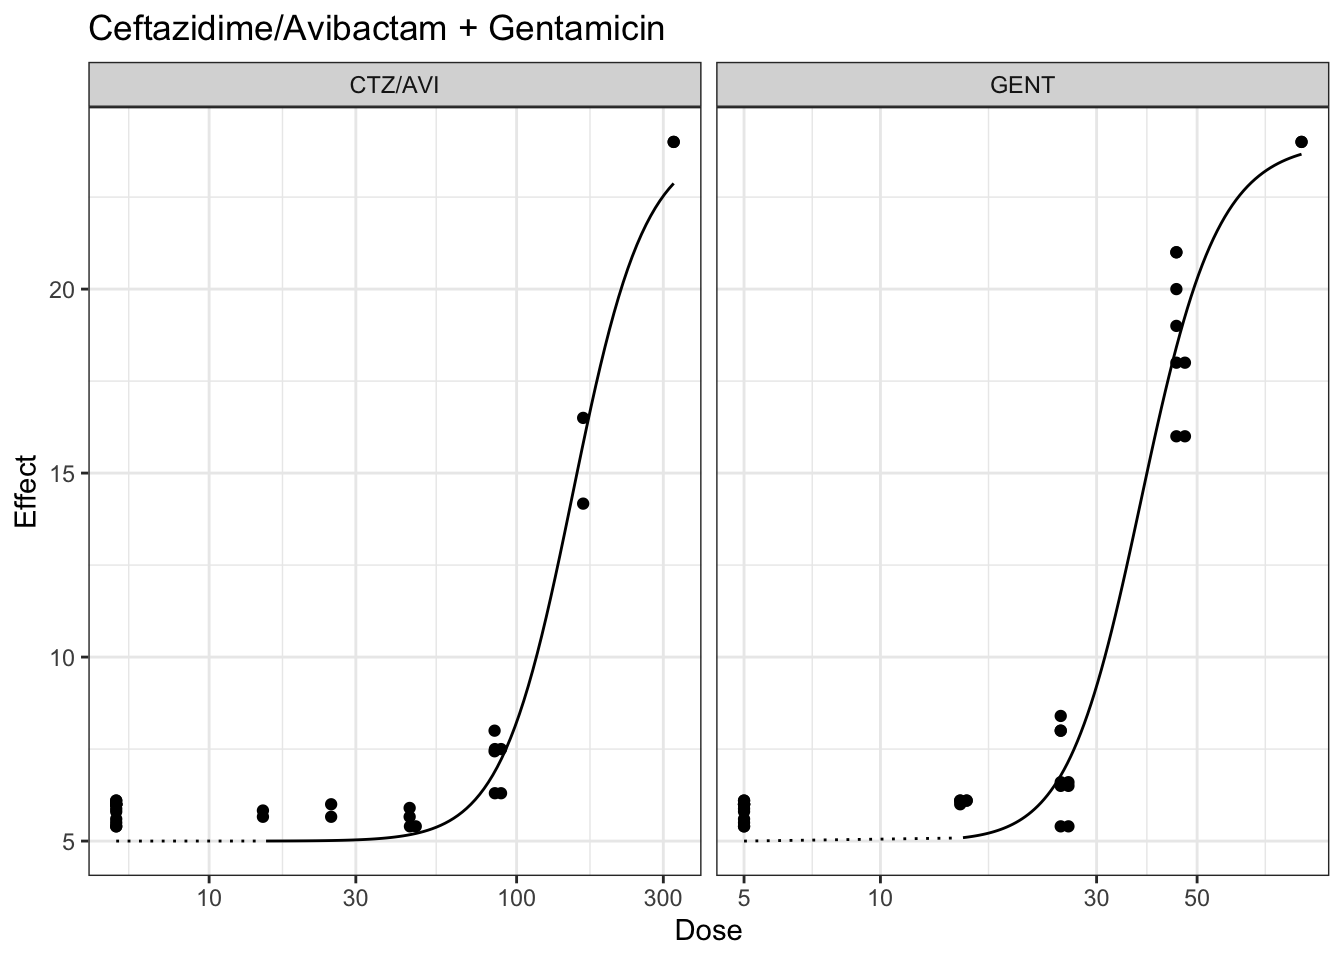
## Plotting marginal model for ceftazidime and gentamicin, minimum constrained at 9 hrs and maximum contrastined at 24 hours
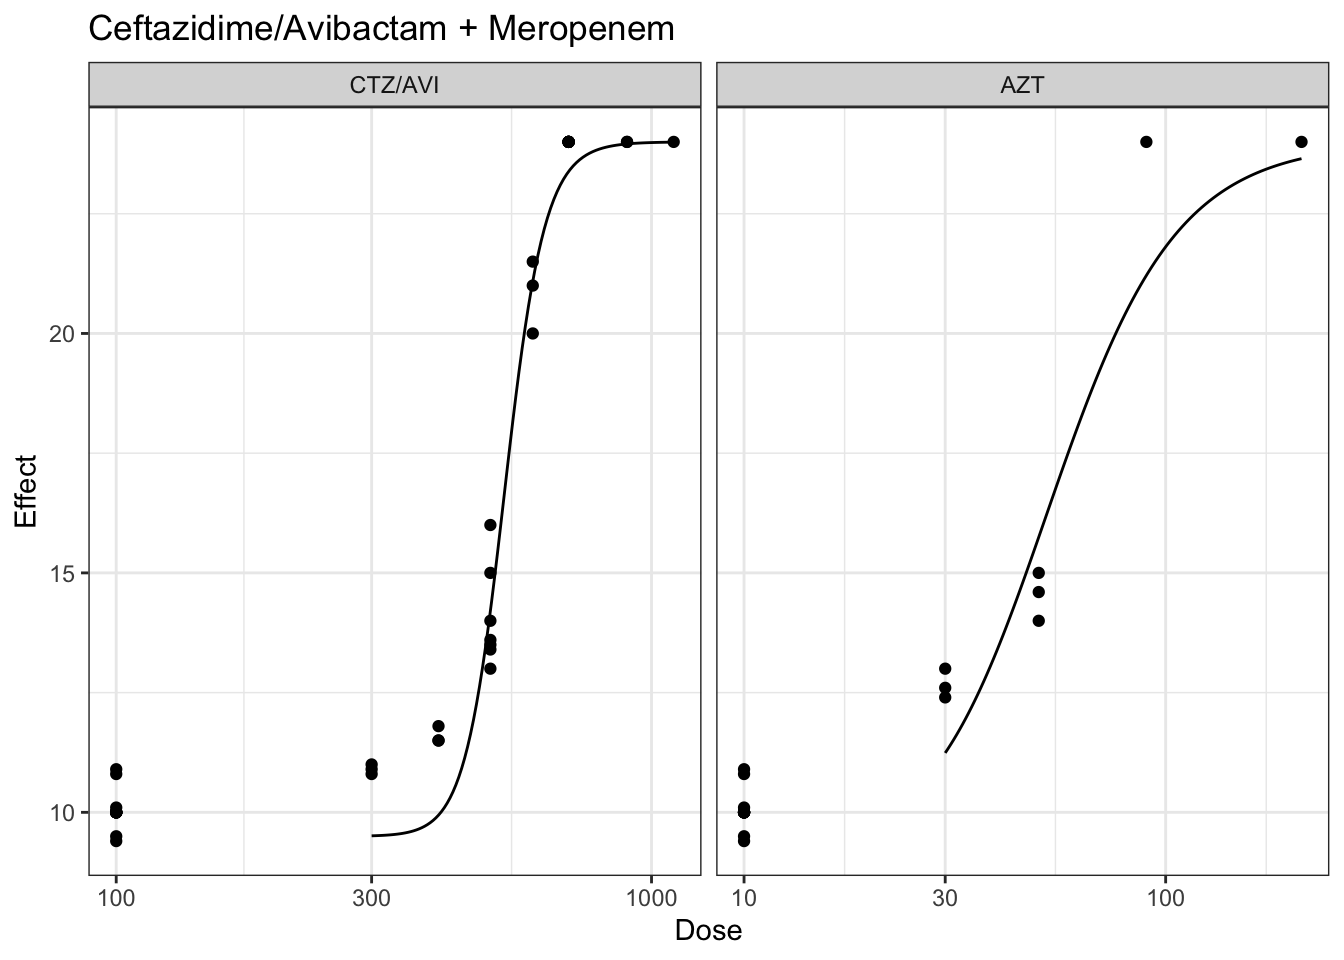
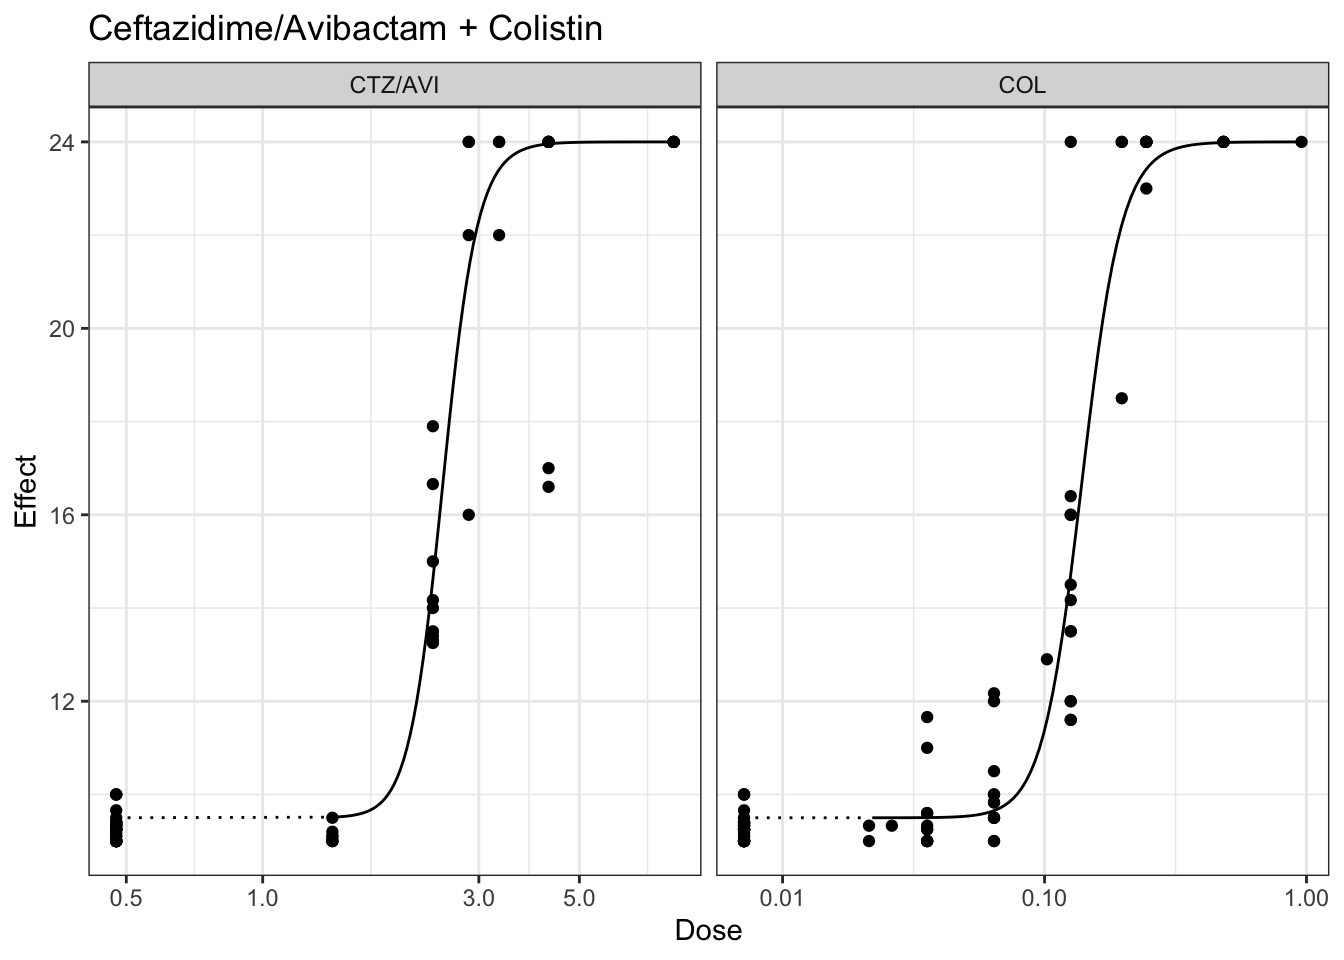
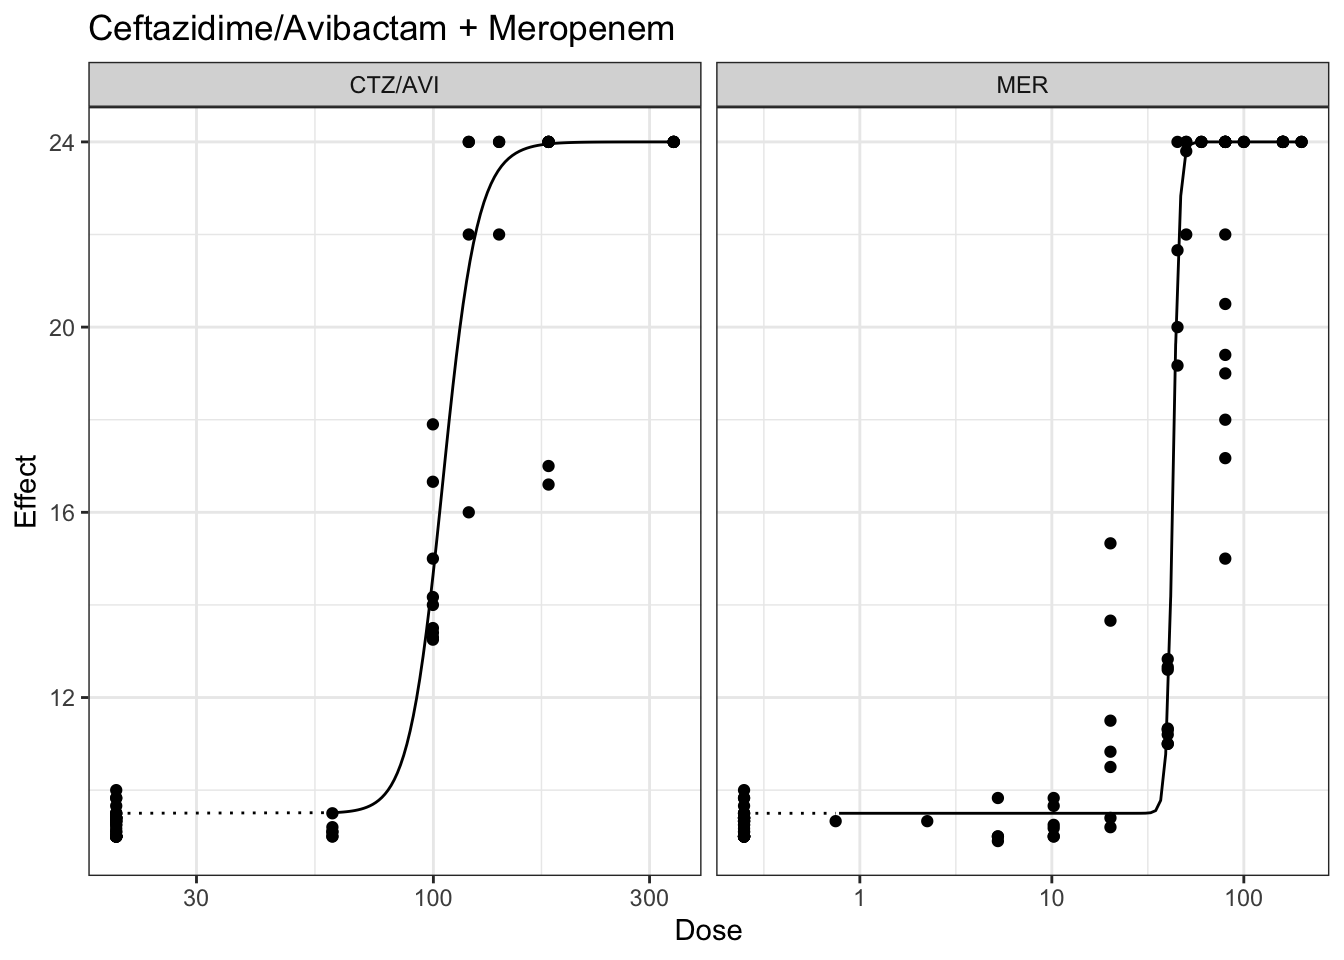
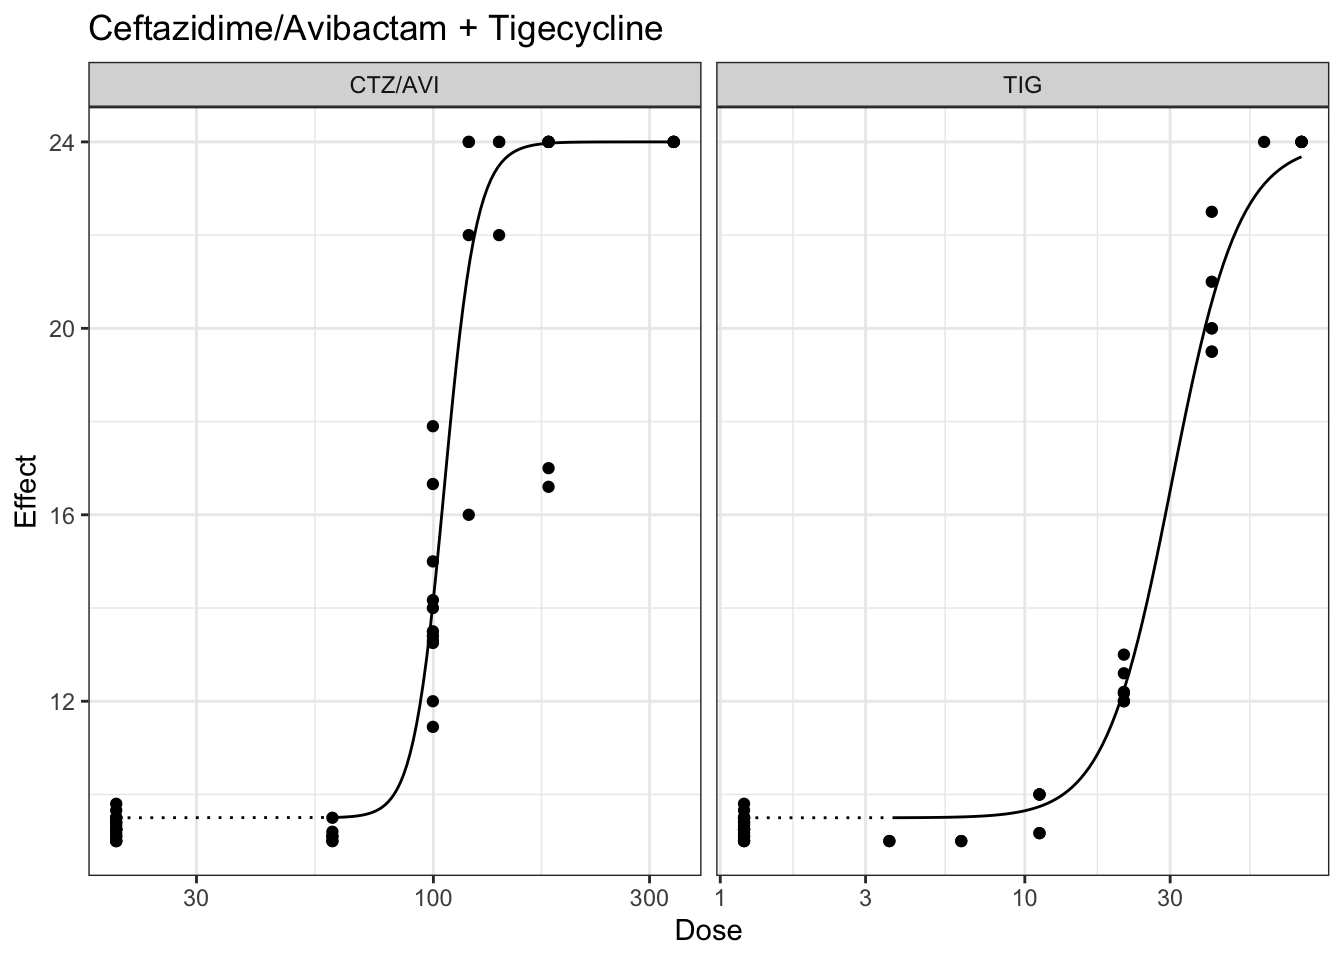
plot(marginalFit) + ggtitle(paste("Ceftazidime/Avibactam + Gentamicin"))
rs <- fitSurface(caz_gent_kpcb, marginalFit,
null_model = "bliss",
B.CP = 50, statistic = "none", parallel = FALSE)
summary(rs)Null model: Bliss independence with shared maximal response
Variance assumption used: "equal"
Formula: effect ~ fn(h1, h2, b = 19/2, m1 = 24, m2 = 24, e1, e2, d1, d2)
Transformations: No

                 CTZ/AVI   GENT
Slope              9.271 13.756
Maximal response  24.000 24.000
log10(EC50)        1.930  1.327

Common baseline at: 9.5
No test statistics were computed.
CONFIDENCE INTERVALS
Overall effect
Estimated mean departure from null response surface with 95% confidence interval:
3.0477 [2.2481, 4.007]
Evidence for effects in data: Syn
Significant pointwise effects
estimate lower upper call
19.95_19.95 6.9764 2.0572 11.8957 Syn
39.9_19.95 9.4952 5.8848 13.1056 Syn
79.8_19.95 6.6173 2.5914 10.6432 Syn
79.8_4.9875 9.3826 2.0492 16.7161 Syn
79.8_9.975 8.9935 6.0041 11.9828 Syn
Pointwise 95% confidence intervals summary:
Syn Ant Total
5 0 15Code
plot(rs, legend = FALSE, main = "")Code
view3d(0, -75)
rglwidget()Code
## mean R statistic evaluates how the test evaluates how the predicted response surface based on a specified null model differs from the observed one. If the null hypothesis is rejected, this test suggests that at least some dose combinations may exhibit synergistic or antagonistic behaviour. The meanR test is not designed to pinpoint which combinations produce these effects nor what type of deviating effect is present.
meanR_N <-fitSurface(caz_gent_kpcb, marginalFit, statistic="meanR",CP=rs$CP, B.B=20, parallel = FALSE)
# maxR test allows to evaluate presence of synergistic/antagonistic effects for each dose combination and as such provides a point-by-point classification.
maxR_N <- fitSurface(caz_gent_kpcb, marginalFit,
statistic = "maxR", CP = rs$CP, B.B = 20,
parallel = FALSE)
maxR_B <- fitSurface(caz_gent_kpcb, marginalFit,
statistic = "maxR", CP = rs$CP, B.B = 20,
parallel = FALSE)
maxR_both <- rbind(summary(maxR_N$maxR)$totals,
summary(maxR_B$maxR)$totals)
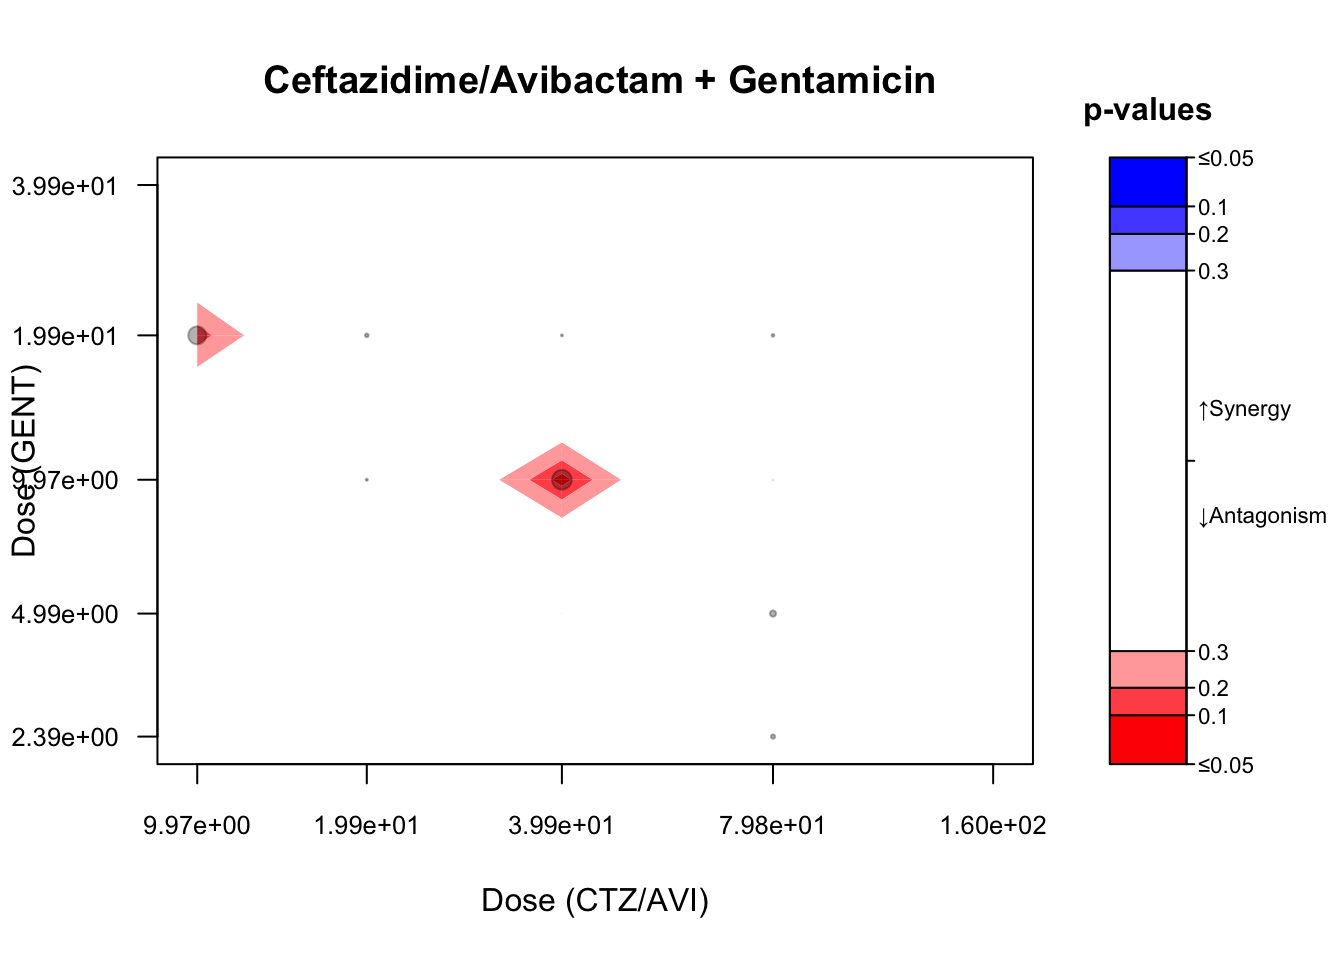
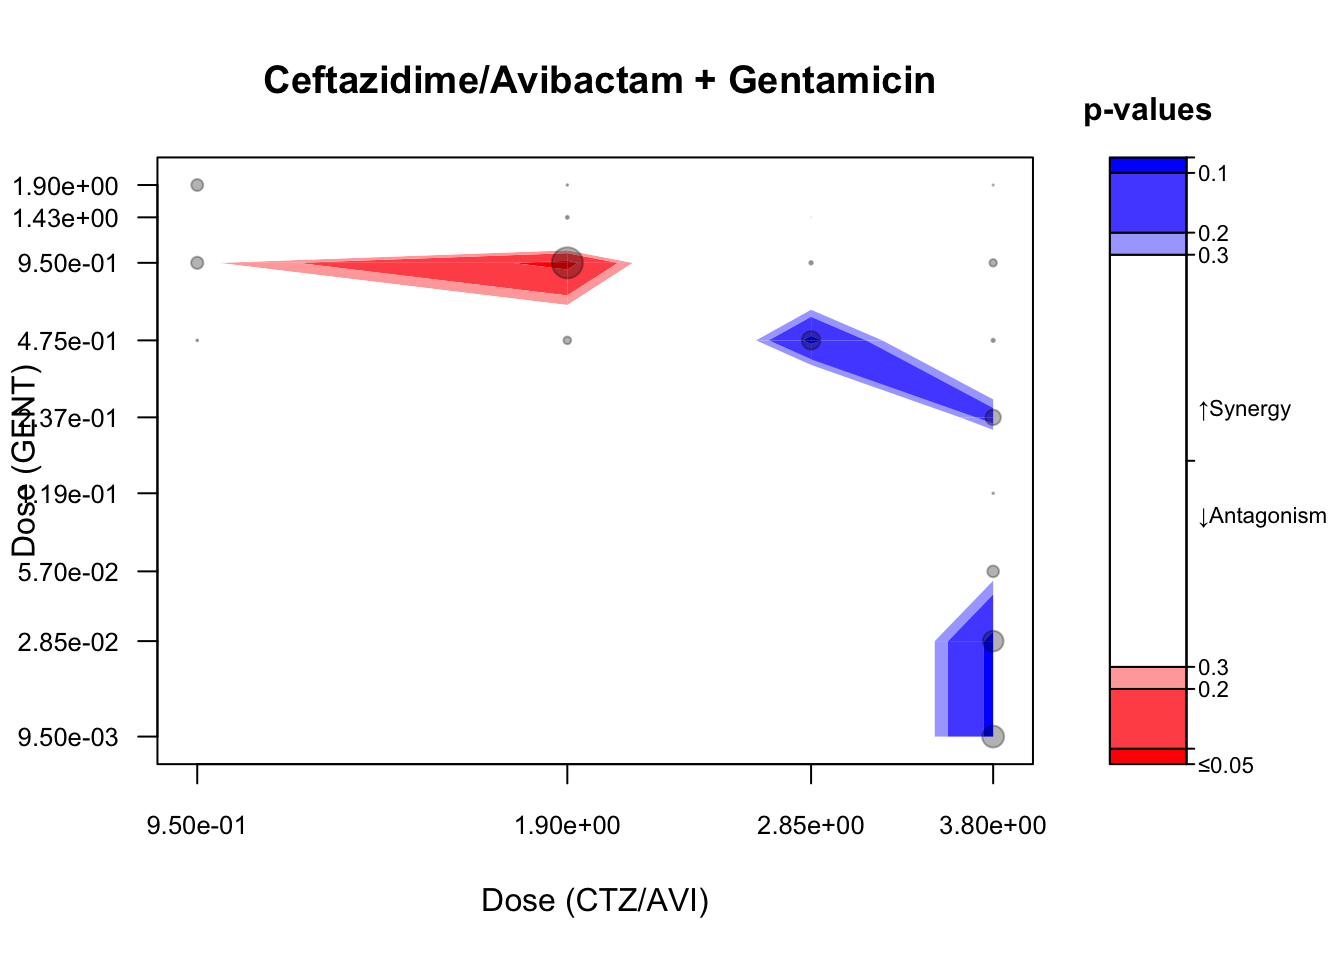
contour(maxR_B,
## colorPalette = c("blue", "black", "black", "red"),
main = paste0(" Ceftazidime/Avibactam + Gentamicin"),
scientific = TRUE, digits = 3, cutoff = cutoff)
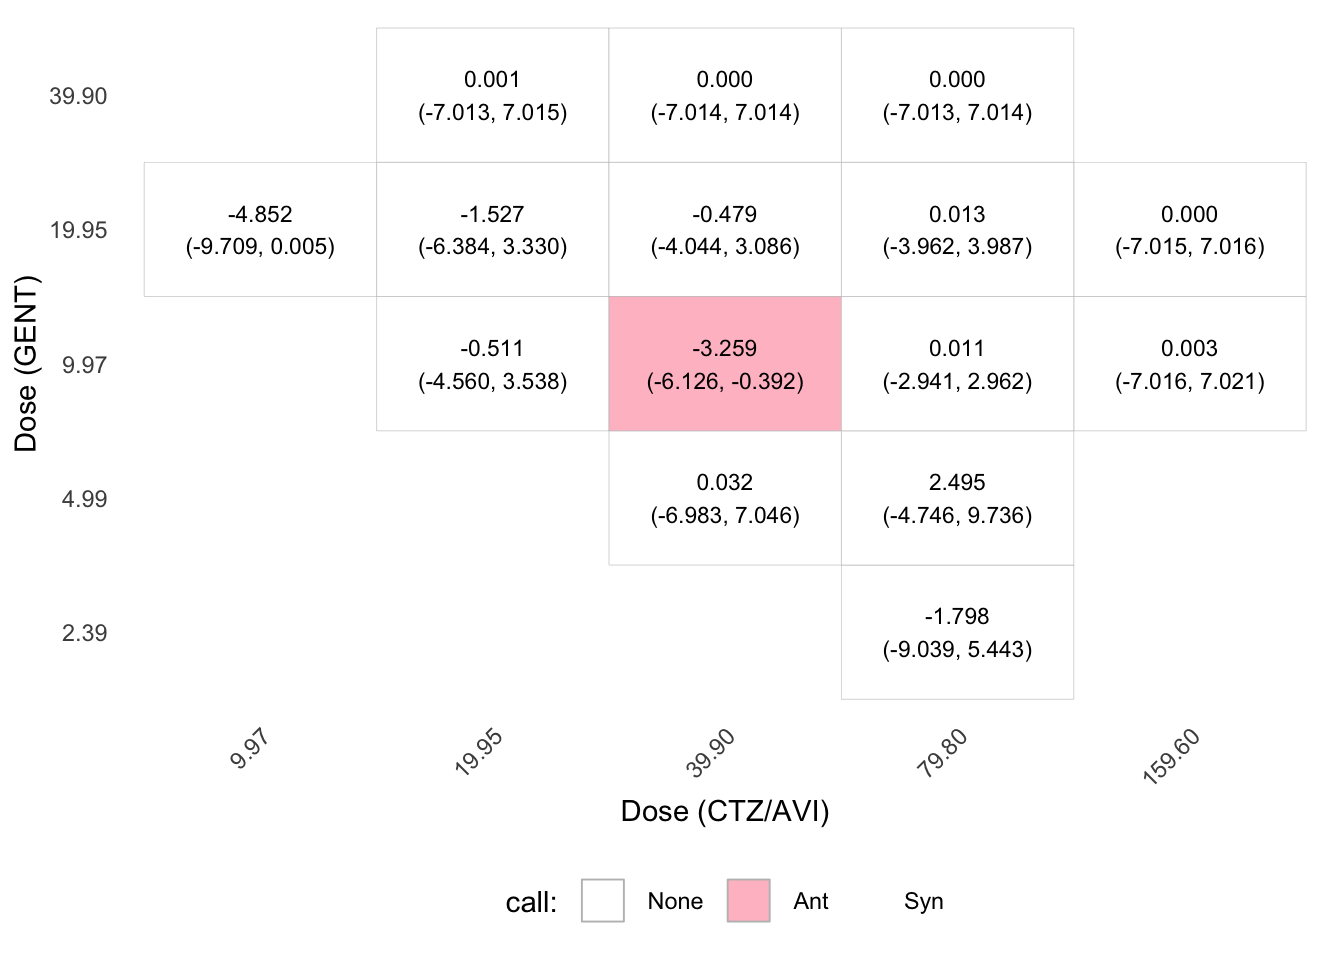
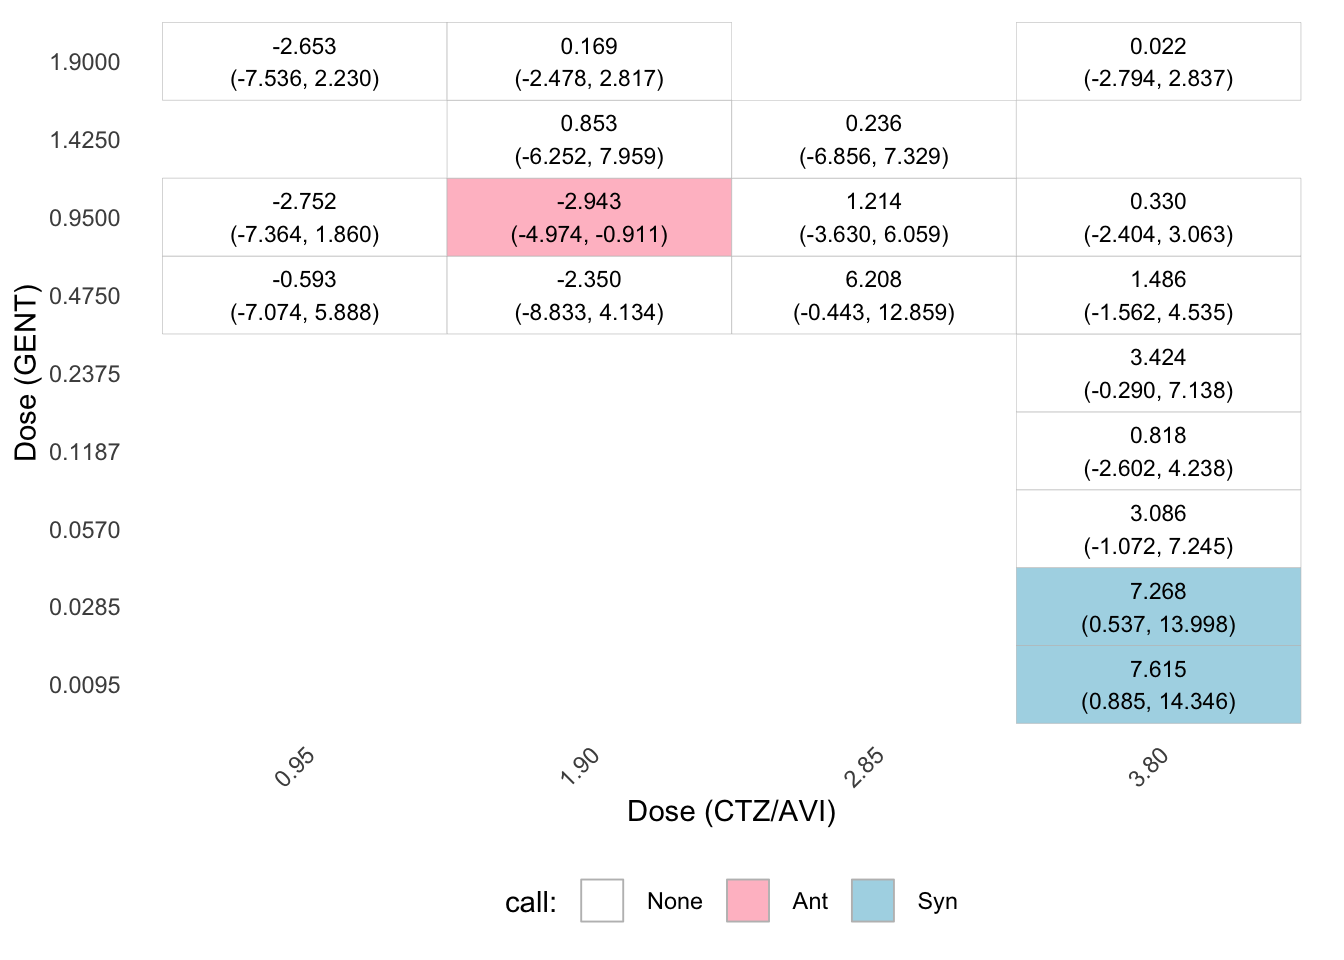
plotConfInt(maxR_B, color ="effect-size")
rsh <- fitSurface(caz_gent_kpcb, marginalFit,
null_model = "hsa",
B.CP = 50, statistic = "both", parallel = FALSE)
summary(rsh)Null model: Highest Single Agent with shared maximal response
Variance assumption used: "equal"
Formula: effect ~ fn(h1, h2, b = 19/2, m1 = 24, m2 = 24, e1, e2, d1, d2)
Transformations: No
CTZ/AVI GENT
Slope 9.271 13.756
Maximal response 24.000 24.000
log10(EC50) 1.930 1.327
Common baseline at: 9.5
Exact meanR test (H0 = no synergy/antagonism):
F(15,87) = 22.8701 (p-value < 2e-16)
Evidence for effects in data: Syn
Points with significant deviations from the null:
d1 d2 absR p-value call
19.95_19.95 19.95 19.9500 4.641679 1e-04 Syn
39.9_19.95 39.90 19.9500 11.185995 <2e-16 Syn
79.8_19.95 79.80 19.9500 8.325151 <2e-16 Syn
79.8_4.9875 79.80 4.9875 4.136343 0.00111 Syn
79.8_9.975 79.80 9.9750 10.250631 <2e-16 Syn
Overall maxR summary:
Call Syn Ant Total
Syn 5 0 15
CONFIDENCE INTERVALS
Overall effect
Estimated mean departure from null response surface with 95% confidence interval:
3.2336 [2.1092, 4.1451]
Evidence for effects in data: Syn
Significant pointwise effects
estimate lower upper call
19.95_19.95 6.9765 3.1071 10.8459 Syn
39.9_19.95 9.5042 6.8960 12.1125 Syn
79.8_19.95 9.3826 6.3518 12.4135 Syn
79.8_4.9875 9.3826 3.1616 15.6037 Syn
79.8_9.975 8.9938 6.5390 11.4485 Syn
Pointwise 95% confidence intervals summary:
Syn Ant Total
5 0 15Code
rsb <- fitSurface(caz_gent_kpcb, marginalFit,
                  null_model = "bliss",
                  B.CP = 50, statistic = "both", parallel = FALSE)
summary(rsb)
Null model: Bliss independence with shared maximal response
Variance assumption used: "equal"
Formula: effect ~ fn(h1, h2, b = 19/2, m1 = 24, m2 = 24, e1, e2, d1, d2)
Transformations: No
CTZ/AVI GENT
Slope 9.271 13.756
Maximal response 24.000 24.000
log10(EC50) 1.930 1.327
Common baseline at: 9.5
Exact meanR test (H0 = no synergy/antagonism):
F(15,87) = 17.7733 (p-value < 2e-16)
Evidence for effects in data: Syn
Points with significant deviations from the null:
d1 d2 absR p-value call
19.95_19.95 19.95 19.9500 4.116661 0.00138 Syn
39.9_19.95 39.90 19.9500 10.126517 <2e-16 Syn
79.8_19.95 79.80 19.9500 4.000327 0.00231 Syn
79.8_4.9875 79.80 4.9875 4.149137 0.00122 Syn
79.8_9.975 79.80 9.9750 10.372249 <2e-16 Syn
Overall maxR summary:
Call Syn Ant Total
Syn 5 0 15
CONFIDENCE INTERVALS
Overall effect
Estimated mean departure from null response surface with 95% confidence interval:
3.0477 [2.1585, 4.0323]
Evidence for effects in data: Syn
Significant pointwise effects
estimate lower upper call
19.95_19.95 6.9764 2.0906 11.8623 Syn
39.9_19.95 9.4952 6.1100 12.8804 Syn
79.8_19.95 6.6173 2.6989 10.5357 Syn
79.8_4.9875 9.3826 1.6980 17.0673 Syn
79.8_9.975 8.9935 5.9019 12.0850 Syn
Pointwise 95% confidence intervals summary:
Syn Ant Total
5 0 15